1-866-731-1999
 Monday – Friday 8:00 am – 5:00 pm

A Marzano Evaluation Center Research Brief on the Focused Teacher and Focused School Leader Evaluation Models

October 2026
Executive Summary
Across 170 Oklahoma schools in 16 districts (teacher model) and 142 schools in 12 districts (school leader model), observation scores from both the Focused Teacher Evaluation Model and the Focused School Leader Evaluation Model were positively linked to school-level English language arts (ELA) and math proficiency.
- Teacher evaluation: Schools with higher Focused Teacher Evaluation Model observation scores had higher ELA and math proficiency (r = .52–.57) and larger gains in proficiency (r = .26–.30).
- School leader evaluation: Schools with higher Focused School Leader Evaluation Model scores also had higher ELA and math proficiency (r = .48–.55) and larger gains in proficiency (r = .18–.34).
- Implication for leaders: Districts can build a coherent evaluation system on models that each show a link to school outcomes.
Why Does Evidence Matter for Teacher and Leader Evaluation?
School districts invest substantial time and resources in teacher and school leader evaluation, using the results to inform professional learning, growth plans, and decisions about instructional support. An important question is whether evaluation scores are associated with student outcomes.
School leadership is central to this question. A synthesis of 219 studies concluded that effective principals improve student achievement, reduce absenteeism, and improve teacher retention (Grissom et al., 2021). The same report estimated that replacing a principal at the 25th percentile of effectiveness with one at the 75th percentile would add about 2.9 months of math learning and 2.7 months of reading learning each year. Those achievement estimates are based on six studies, mostly from elementary and middle schools in a few states and districts.
Research also suggests that evaluation may contribute to changes in instructional practice. In a study of 105 experienced teachers in Cincinnati, students scored 0.11 standard deviations higher in math in the years after their teacher went through a rigorous, observation-based evaluation than in the years before (Taylor & Tyler, 2012).
Limited research has examined whether teacher and school leader observation scores are associated with school-level student outcomes. This brief addresses that gap by examining the relationships between scores from two Marzano evaluation models and ELA and mathematics proficiency across Oklahoma schools.
How Do the Marzano Evaluation Models Work Together?
The Marzano Evaluation Center offers four evaluation models, for teachers, school leaders, district leaders, and support staff, designed to work together as one coherent system. The school leader model uses the same five-point scale (Not Using, Beginning, Developing, Applying, and Innovating) as the teacher, support staff, and district leader models (Carbaugh & Marzano, 2023), so evaluators and educators can use a common language across roles.
Focused Teacher Evaluation Model
The Focused Teacher Evaluation Model focuses observation on 23 elements across four domains: Standards-Based Planning, Standards-Based Instruction, Conditions for Learning, and Professional Responsibilities. It condenses the original 60-element Marzano Teacher Evaluation Model into 23 elements intended to support more focused observation and scoring (Basileo & Toth, 2025). The elements are described in greater detail in Mastering the Marzano Elements.
Focused School Leader Evaluation Model
The Focused School Leader Evaluation Model measures school leaders’ practice across 21 elements in six domains (Carbaugh & Marzano, 2023):
- A Data-Driven Focus on School Improvement
- Instruction of a Viable and Guaranteed Curriculum
- Continuous Development of Teachers and Staff
- Community of Care and Collaboration
- Core Values
- Resource Management
The model draws on the research literature on school leadership, including the Marzano, Waters, and McNulty (2005) meta-analysis and the 2011 What Works in Oklahoma Schools study (Marzano Research Laboratory, 2011).
A Coherent System
Together with the district leader and support staff models, the two models are designed to establish shared expectations and a common language for effective practice across professional roles. This brief looks at the teacher and school leader models separately.
What Does Previous Research Show About Marzano Observation Scores?
Across the broader research on classroom observation tools, correlations between observation scores and teacher value-added measures are typically small to moderate. A review of published studies found that most coefficients fell in the small-to-moderate range and that smaller-scale studies tended to report larger correlations (Basileo & Toth, 2019). Studies of the Marzano models have reported similar patterns:
- Classic Marzano model in Florida: In a study of more than 12,000 teachers across three school years, observation scores showed small, positive, statistically significant correlations with teacher value-added measures (r = .145 to .226). In multilevel models that accounted for student, teacher, and school characteristics, the observation score was the largest statistical predictor (Basileo & Toth, 2019).
- Focused Teacher Evaluation Model in Florida: In the first year of the Focused Teacher Evaluation Model (2017–18), a study of 488 teachers in nine Florida districts found small-to-moderate positive correlations with value-added measures (r = .246 combined, .178 in ELA, and .328 in math; all p < .01) (Basileo & Toth, 2025).
These studies examined individual teachers using growth-based outcomes. The present study extends this research by examining school-level outcomes and including both the Focused Teacher Evaluation Model and the Focused School Leader Evaluation Model.
Study Design
The Marzano Evaluation Center and Instructional Empowerment’s Applied Research Center analyzed school-level data from 16 districts in Oklahoma (12 of which also provided school leader data) to examine whether teacher and school leader observation scores were associated with student proficiency.
Study Sample at a Glance
| Sample detail | Focused Teacher Evaluation Model analysis | Focused School Leader Evaluation Model analysis |
|---|---|---|
| State | Oklahoma | |
| Grade levels | Pre-K–12 school settings, including elementary, intermediate, middle, and high schools | |
| Districts | 16 | 12 |
| Schools | 170 (169 for the 2023–24 math proficiency correlations) | 153 school buildings; 141–142 schools included in the achievement correlations |
| Observed educators | 5,283 teachers | 371 unique school leaders identified in 374 school–leader records |
| Observations | 96,219 evaluative scores from 15,893 observations by 648 observers (Aug. 1, 2023–Jul. 31, 2024) | Observation counts and dates were not available for the school leader dataset |
Data Sources and Measures
- Observation scores: Observers scored teachers on the Focused Teacher Evaluation Model and school leaders on the Focused School Leader Evaluation Model using the five-point scale (0–4). Scores were averaged to create a school-level overall observation score for each model.
- Student outcomes: School-level percent proficient on state ELA and math assessments in 2022–23 and 2023–24, and the change in percent proficient between the two years.
Analysis
The analysis used Pearson correlations (r) to measure the direction and strength of the relationship between each school’s overall observation score and each proficiency outcome, with two-tailed significance tests. For the Focused School Leader Evaluation Model, correlations were also run for each of the six domains. The correlations indicate the extent to which higher observation scores were associated with higher proficiency across schools; they do not establish a causal relationship.
Download the full research brief
Get the 14-page PDF with all findings, figures, and references to share with your leadership team.
Key Findings
How Should These Correlations Be Read?
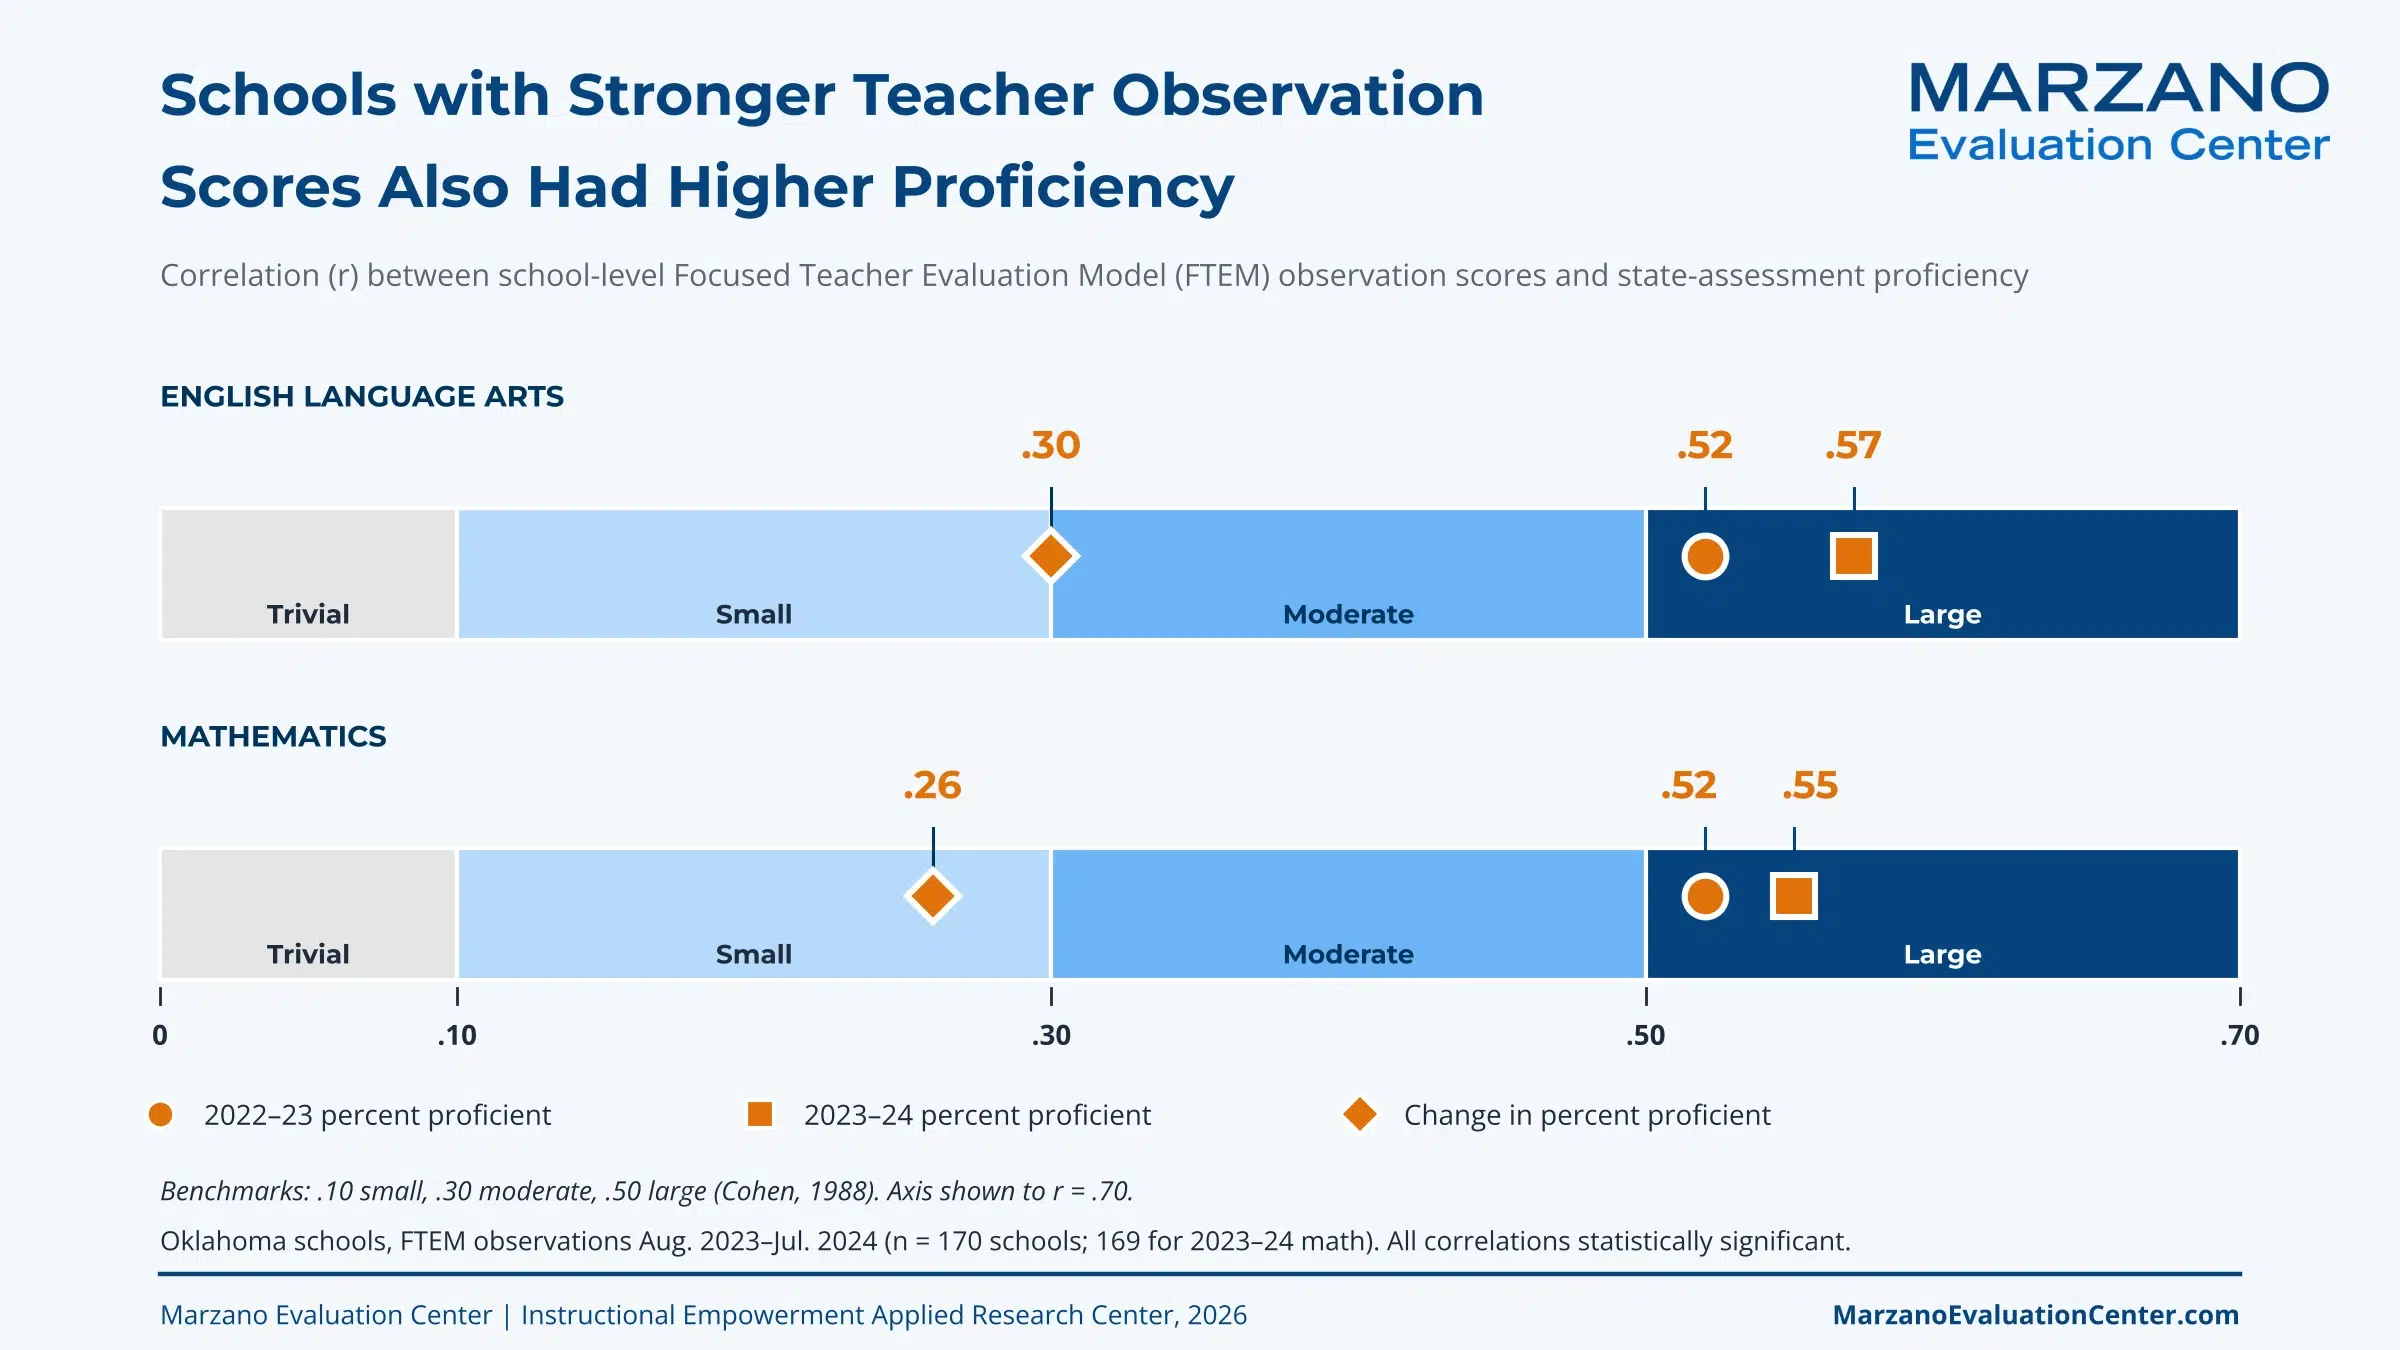
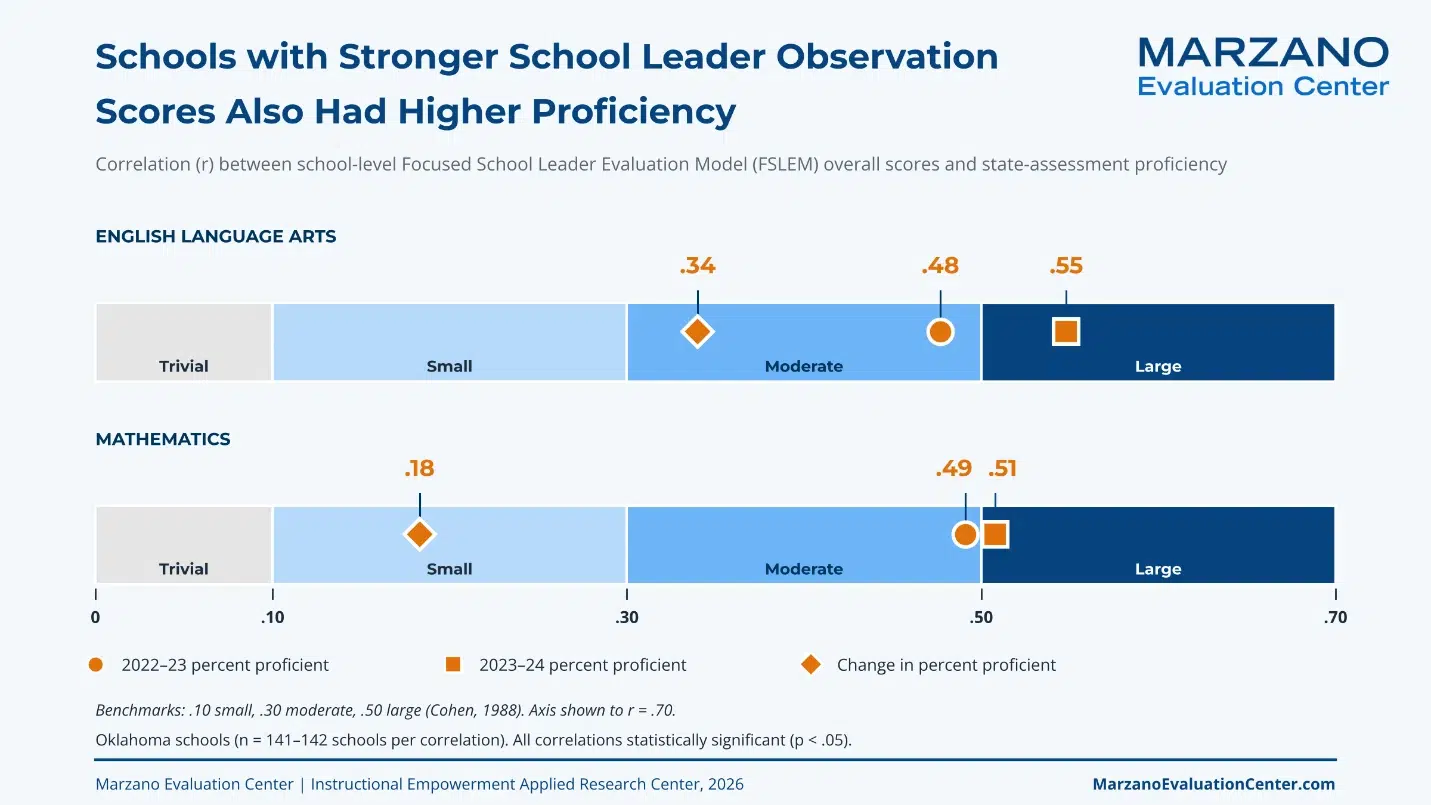
A correlation (r) ranges from −1.0 to +1.0, with 0 indicating no linear relationship, +1.0 indicating a perfect positive relationship, and −1.0 indicating a perfect negative relationship. According to commonly used benchmarks, correlations of approximately .10 are considered small, .30 moderate, and .50 large (Cohen, 1988).
These analyses examine school-level relationships, meaning the findings describe associations between school evaluation scores and school achievement outcomes rather than the effectiveness of individual teachers or school leaders.
They are also not directly comparable to teacher-level value-added correlations reported in earlier Florida studies, because those studies used a different unit of analysis and growth-based achievement measures. Although changes in school proficiency provide a closer conceptual comparison to student growth, they are not equivalent to value-added measures, which typically account for prior achievement and other factors.
r = .52–.57
Teacher scores and school proficiency
r = .48–.55
School leader scores and school proficiency
r = .18–.34
Both models: scores and change in proficiency
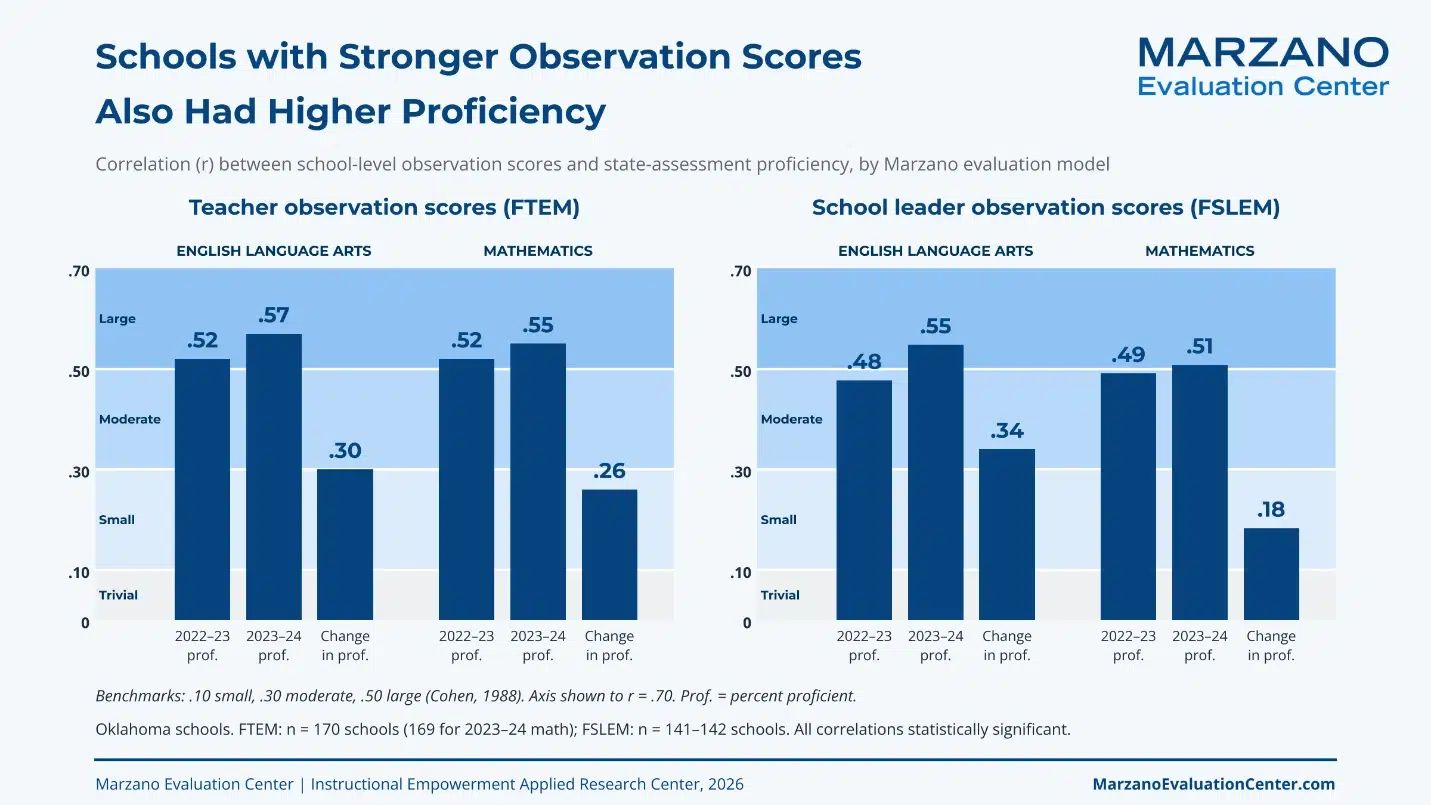
Figure 1 gives an overview. The next two figures show the same correlations on the effect-size scale, relative to the benchmarks.
Relationship Between Teacher Observation Scores and School Proficiency
Higher Focused Teacher Evaluation Model observation scores were associated with higher school-level proficiency in both subjects. Correlations with percent proficient ranged from r = .52 to .57, representing large associations according to Cohen’s (1988) benchmarks: ELA r = .52 (2022–23) and .57 (2023–24), and math r = .52 (2022–23) and .55 (2023–24). Correlations with changes in proficiency were smaller, r = .30 for ELA and r = .26 for math, representing small to moderate associations. All correlations were statistically significant (p < .001).
Every Focused Teacher Evaluation Model domain was significantly and positively correlated with both ELA and math proficiency, with Standards-Based Instruction demonstrating the strongest associations.
Relationship Between School Leader Observation Scores and School Proficiency
Higher overall Focused School Leader Evaluation Model observation scores were associated with higher school-level proficiency in both subjects. Correlations with percent proficient in ELA were r = .48 (2022–23) and .55 (2023–24), and math r = .49 (2022–23) and .51 (2023–24). Correlations with changes in proficiency were smaller, r = .34 for ELA (p < .001) and r = .18 for math (p = .030). All correlations were statistically significant.
Domain- and Element-Level Associations
All six Focused School Leader Evaluation Model domains were positively correlated with proficiency (r = .37 to .51, all p < .001).
- Domain II (Instruction of a Viable and Guaranteed Curriculum) demonstrated the strongest correlations for 2022–23 ELA (r = .49) and math (r = .47).
- Domain IV (Community of Care and Collaboration) demonstrated the strongest correlations with 2023–24 ELA (r = .51) and math proficiency (r = .48) as well as changes in ELA proficiency (r = .39).
- Domain I (A Data-Driven Focus on School Improvement) had the strongest correlation with changes in math proficiency (r = .25, p = .003).
| Focused School Leader Evaluation Model domain | 2022–23 ELA | 2023–24 ELA | ELA change | 2022–23 math | 2023–24 math | Math change |
|---|---|---|---|---|---|---|
| I. Data-Driven Focus on School Improvement | .373*** | .471*** | .375*** | .424*** | .467*** | .254** |
| II. Viable and Guaranteed Curriculum | .491*** | .497*** | .240** | .468*** | .447*** | .079 |
| III. Continuous Development of Teachers and Staff | .410*** | .457*** | .284*** | .432*** | .425*** | .097 |
| IV. Community of Care and Collaboration | .415*** | .507*** | .388*** | .449*** | .479*** | .221* |
| V. Core Values | .382*** | .421*** | .260** | .387*** | .370*** | .060 |
| VI. Resource Management | .384*** | .414*** | .234* | .382*** | .380*** | .110 |
| Overall Focused School Leader Evaluation Model score | .477*** | .548*** | .340*** | .491*** | .508*** | .183* |
Note. Pearson correlations between school-level Focused School Leader Evaluation Model scores and outcomes. *p < .05, **p < .01, ***p < .001; gray italics = not statistically significant. Shaded cells are r ≥ .50. N = 115–137 schools per domain correlation (141–142 for the overall score).
Several individual elements showed comparatively strong associations with specific outcomes. These element-level results are exploratory.
- Element IV(1), ensuring teachers work in collaborative groups to plan and discuss instruction, curriculum, assessments, and student achievement: correlated with changes in ELA proficiency (r = .40, p < .001) and math proficiency (r = .23, p = .010).
- Element IV(4), acknowledging the school’s successes and celebrating the diversity and culture of each student: correlated with 2023–24 ELA (r = .49) and math (r = .50) proficiency (both p < .001).
- Element III(1), hiring, supporting, and retaining personnel who continually demonstrate growth: correlated with 2023–24 ELA (r = .56) and 2022–23 math (r = .56) proficiency (both p < .001).
What Are the Limitations of This Research?
Several limitations should be considered when interpreting these school-level correlations:
- Correlation, not causation: The analysis cannot show that higher observation scores cause higher proficiency. Schools with higher observation scores may differ systematically in other characteristics associated with student proficiency.
- No statistical controls: The correlations do not adjust for school characteristics, such as student poverty, prior achievement, or enrollment, that may relate to both proficiency and observation ratings.
- School-level averages: Results describe relationships among schools, not individual teachers or school leaders.
- Variation in observation practices: Potential differences in observer training and the number of observations conducted per educator could affect the reliability and comparability of scores across schools.
- Generalizability: The results come from Oklahoma schools using the Marzano models and may not generalize to other settings.
- Models examined separately: This analysis did not test the Focused Teacher Evaluation Model and Focused School Leader Evaluation Model together.
What Should Education Leaders Take Away from This Research?
- Teacher and school leader observation scores were positively associated with school proficiency. Across the Oklahoma schools examined in the two datasets, higher Focused Teacher Evaluation Model and Focused School Leader Evaluation Model scores were associated with higher ELA and mathematics proficiency, with the strongest relationships for proficiency levels (r = .48–.57) and smaller but positive relationships for change in proficiency (r = .18–.34).
- The models provide a common framework for evaluation across professional roles. Each model, analyzed on its own here, was linked to school outcomes. Because the teacher and school leader models share a common rating scale and research foundations, they provide districts with consistent terminology for describing effective practice across roles.
- Evaluation data may inform priorities for professional learning and support. Domain- and element-level results may help identify practices for further examination and professional learning, although the observed associations should not be interpreted as causal effects.
Taken together, the findings extend the evidence on relationships between Marzano observation scores and student outcomes. Additional research using longitudinal designs, statistical controls, and data from varied settings is needed to assess the robustness of these associations and the mechanisms that may explain them.
Suggested Citation: Marzano Evaluation Center, Applied Research Center. (2026). Is teacher and school leader evaluation linked to student achievement? A Marzano Evaluation Center research brief on the Focused Teacher and Focused School Leader Evaluation Models. https://marzanoevaluationcenter.com/library/teacher-and-school-leader-evaluation-linked-to-student-achievement/
Ready to explore how the Marzano evaluation models could support your district? Contact us to start the conversation.
Frequently Asked Questions
What are the Focused Teacher Evaluation Model and the Focused School Leader Evaluation Model?
The Focused Teacher Evaluation Model and the Focused School Leader Evaluation Model are two of the four Marzano evaluation models, which also include models for district leaders and support staff. The Focused Teacher Evaluation Model uses 23 elements across four domains to evaluate teacher practice; the Focused School Leader Evaluation Model uses 21 elements across six domains to evaluate school leader practice. Both use a five-point scale from Not Using (0) to Innovating (4).
What did this research find?
In Oklahoma schools, higher Focused Teacher Evaluation Model and Focused School Leader Evaluation Model observation scores were associated with higher ELA and math proficiency (r = .48–.57 across both models) and, to a smaller degree, with changes in proficiency (r = .18–.34).
How strong are these correlations?
By conventional benchmarks (Cohen, 1988), an r of .50 or higher is large. Most proficiency correlations in this study were at or near that level, while the change-in-proficiency correlations ranged from small to moderate. Because these are school-level correlations, they are not directly comparable with the teacher-level value-added correlations in earlier studies, which are typically small to moderate (Basileo & Toth, 2019).
Does this research prove that evaluation scores cause higher student achievement?
No. The analysis shows relationships among schools but does not show cause and effect, and it did not adjust for school characteristics such as student poverty. The findings indicate that Marzano observation scores were associated with variation in school-level outcomes in this sample.
What is the difference between proficiency and change in proficiency?
Proficiency is the percent of students who met the proficient standard on the state assessment in a given year. Change in proficiency is the percentage-point difference in proficiency rates between two years.
How do the Marzano evaluation models work together?
The four models are designed to work together as one system, with shared research foundations and a common five-point scale. This brief examined the teacher and school leader models separately and did not test them in combination.
Where can I learn more about the models?
Visit the Focused Teacher Evaluation Model and Focused School Leader Evaluation Model pages, read Mastering the Marzano Elements, or browse the Library.
About the Research Analyst
Dr. Lindsey Devers Basileo is the Director of Research at Instructional Empowerment’s Applied Research Center. She earned her doctorate from Florida State University in 2010 and is a nationally certified reviewer for the What Works Clearinghouse, specializing in Group Design Standards (Versions 4.0 and 4.1). Her research interests include school improvement, educational innovations, self-determination theory, Diffusion of Innovation theory, Group Design Standards, survey design and collection, and both quantitative and qualitative methods. Dr. Basileo has authored multiple peer-reviewed studies and reports on instructional models, school improvement, and educator practice.
References
Basileo, L. D., & Toth, M. D. (2019). A state level analysis of the Marzano Teacher Evaluation Model: Predicting teacher value-added measures with observation scores. Practical Assessment, Research, and Evaluation, 24(6). https://openpublishing.library.umass.edu/pare/article/id/1586/
Basileo, L. D., & Toth, M. D. (2025). Reforming teacher evaluation in a time of change: Evidence of the Marzano Focused Teacher Evaluation Model (MEC07-03). Marzano Evaluation Center. https://marzanoevaluationcenter.com/library/evidence-for-the-marzano-focused-model-reforming-teacher-evaluation-in-a-time-of-change/
Carbaugh, B. G., & Marzano, R. J. (2023). The Marzano Focused School Leader Evaluation Model: Reframing the right balance for instructional and operational leadership. Marzano Evaluation Center. https://marzanoevaluationcenter.com/library/the-marzano-focused-school-leader-evaluation-model/
Cohen, J. (1988). Statistical power analysis for the behavioral sciences (2nd ed.). Lawrence Erlbaum Associates.
Grissom, J. A., Egalite, A. J., & Lindsay, C. A. (2021). How principals affect students and schools: A systematic synthesis of two decades of research. The Wallace Foundation. https://wallacefoundation.org/report/how-principals-affect-students-and-schools-systematic-synthesis-two-decades-research
Marzano, R. J., Waters, T., & McNulty, B. A. (2005). School leadership that works: From research to results. Association for Supervision and Curriculum Development.
Marzano Research Laboratory. (2011). What works in Oklahoma schools: A comprehensive needs assessment of Oklahoma schools: Phase 2 report. https://eric.ed.gov/?id=ED539799
Taylor, E. S., & Tyler, J. H. (2012). The effect of evaluation on teacher performance. American Economic Review, 102(7), 3628–3651. https://doi.org/10.1257/aer.102.7.3628